PROJECTS
Fuel Moisture Sampling Support
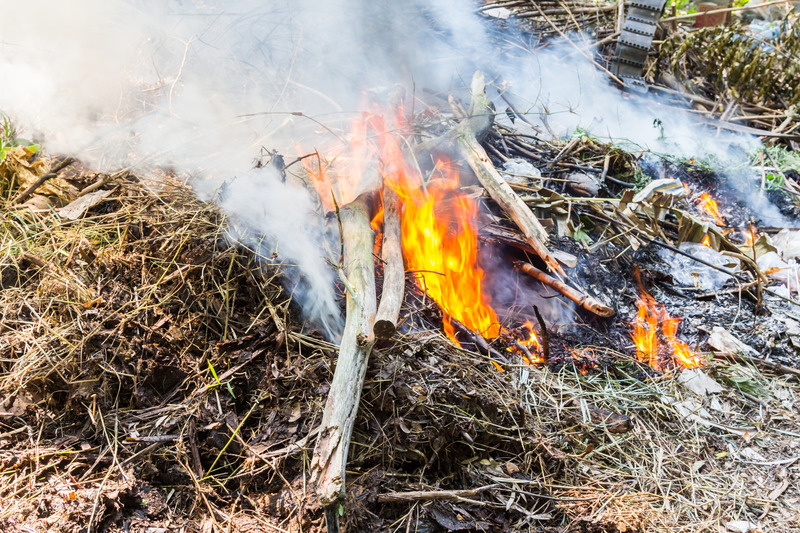
Fuel moisture sampling can provide useful insight to current conditions, something that informs procedure for more than just firefighting agencies.
Beginning in 2019, public utilities in California and Nevada implemented fuel moisture sampling programs to aid in Public Safety Power Shutoff decisions. Results from these samplings are analyzed and fire danger indices, like Energy Release Component, are calculated before being uploaded to a live dashboard (https://fuelmoisture.com/). This enables utilities and agency partners to share valuable fire risk information in a familiar format and nomenclature.
Delaney has been integrally involved since the start of these projects, initially collecting the samples in the field although her role has transitioned to heading up the analysis and calculation aspect for the past several years. Quality assurance/quality control and dissemination of results have been her focus most recently.
Fire Comparison Dashboard
This dashboard combines fire modeling, risk assessment, weather, and Risk Management Assistance (RMA) analytics into a concise format to facilitate fire comparisons and inform prioritization at the Multi Area Coordination (MAC)/Geographic Area Coordination Center (GACC), regional, state, and unit level (e.g., Forest). The dashboard allows viewers to see all current fires in the continental U.S. by:
- Prioritization – this tab shows the top fires based on ranking criteria, geographic area, or state.
- Fires Comparison – this tab allows viewers to sort fires by highly valued resources and assets (HVRAs), Suppression Difficulty Index (SDI), or the 5-day Severe Fire Danger Index (SFDI).
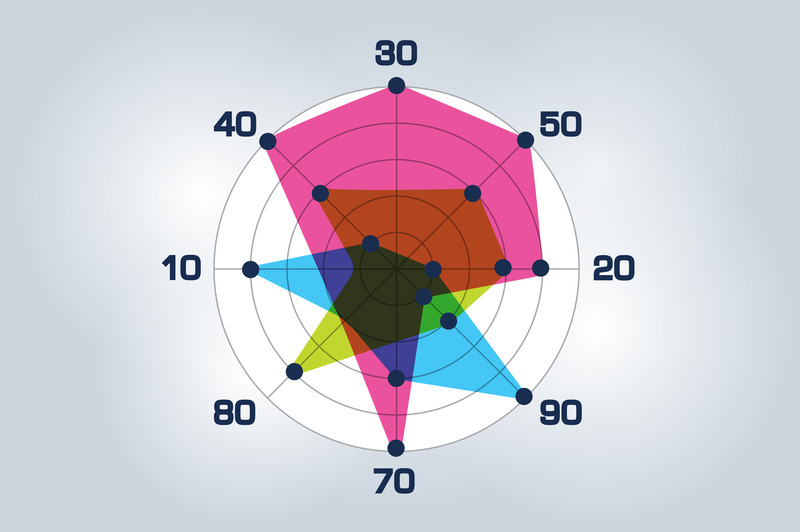
- Radar Charts – this tab shows key HVRAs (i.e., structures, people impacted, potential timber, drinking water, major roads, and critical infrastructure) as a graphic; the charts are scaled based on the maximum HVRA value nationwide, by GACC, or by state.
Initial setup and ongoing maintenance of the dashboard, including implementation of new features, has been handled by Delaney.
Quarterly Red Flag/High Wind Warnings
Public utilities in California are required to submit certain data and metrics for their service territories and infrastructure to the Public Utilities Commission (CPUC) each quarter. One of these required metrics is the number of circuit line-miles within the service territory that were in each of CalFire’s Fire Hazard Severity Zones and for which a Red Flag or High Wind Warning was issued by the National Weather Service.
The original process for calculating these values was developed by Chris Lautenberger at Reax Engineering. Subsequent modifications to the original programming have been performed by Delaney, including converting the coding into Python.
Klamath River Renewal Corporation
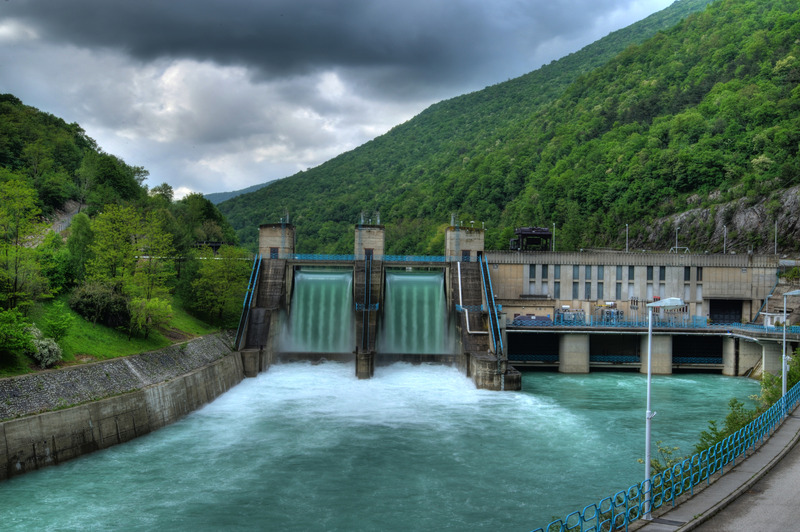
Plans were made to remove four hydroelectric dams along the Klamath River in southern Oregon and Northern California. However, before these plans could be approved, current uses and impacts of dam removal had to be considered.
Impacts to fire risk were of paramount importance, including water availability for helicopters, increase in vegetation along the banks, and changes in recreational uses of the Klamath River.
Delaney was part of a team tasked with analyzing these changes and their collective influence on fire risk within the project area. She performed much of the GIS data aggregation and analysis of current conditions and projected future conditions both if the dam removal took place and if it did not.
Installation of fire cameras at fire lookouts on surrounding mountains was suggested as a mitigation measure. Delaney aided in performing geospatial viewshed analyses to illustrate the amount of the project area that would be visible to these cameras and the expected detection time were a fire to occur in the project area.
Wildfire Spread Litigation Support
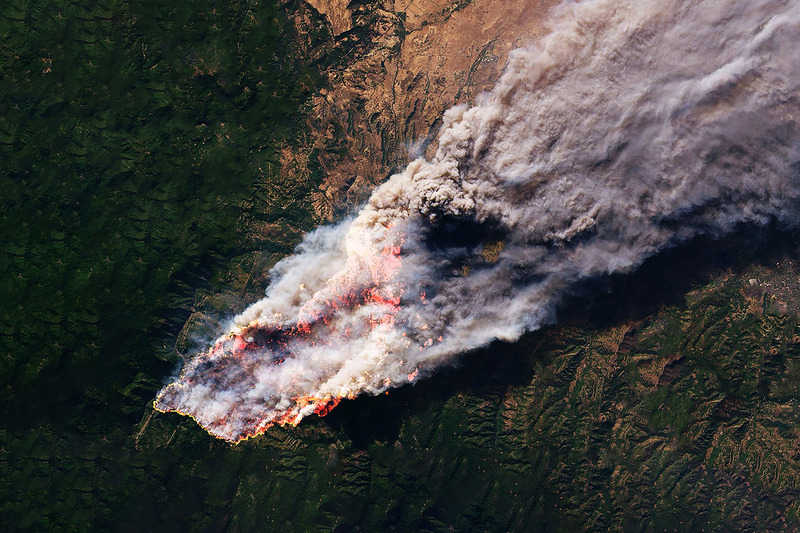
Delaney has been involved in the acquisition and analysis of satellite imagery, weather forecasts, 911 call logs, and geospatial fire perimeter data on several large-loss wildfires. The primary purpose of this work is often to understand how a fire started and determine how it spread.
This is a critical component for merged fires with multiple ignitions, separating out which damages were caused by which ignition wherever possible. She has created timelines of events in GIS software so that known data points, like 911 calls, appear in sequence with other data, like fire perimeters or satellite detections from MODIS and VIIRS.
Areas Served:
California and the Continental US
Address
- 909-809-2440
- [email protected]
-
143 Dorer Dr. Apt B
Auburn CA 95603
Copyright 2025 Blaze Engineering and Analysis | Site Designed by Jucebox Local Marketing Partners
